
Published on November 26, 2024
China’s Fiscal Stimulus: A Repeat of Japan?
Introduction
China’s fiscal stimulus echoes Japan’s pre-stagnation strategies: heavy infrastructure spending, state intervention, and aggressive debt-financing. This approach, which led to Japan’s “lost decade” of deflation and economic stagnation, raises questions about China’s future. In recent months, China’s GDP growth rate has slowed to 4.5%, well below the double-digit growth of prior years, prompting the government to introduce expansive fiscal and monetary measures.
Japan's history offers a cautionary lesson. In the 1980s, Japan pursued rapid growth funded by easy monetary policies and high public spending, leading to asset bubbles in real estate and stocks. The eventual bursting of these bubbles left Japan with years of deflation, high debt, and weak economic performance.
Why the Comparison?
China’s current fiscal stimulus bears a resemblance to Japan’s pre-stagnation. The similarities are underscored by recent policy actions:
- Cutting reserve requirements by 0.5%: The People’s Bank of China (PBOC) lowered the reserve requirement ratio to inject liquidity, enabling banks to increase lending. This cut has freed up an estimated $46 billion for loans, though recent data shows only modest credit demand.
- Reducing the 7-day reverse repurchase (RRP) rate by 0.2%: This reduction aims to ease short-term borrowing costs, providing liquidity to financial institutions and alleviating credit strains for businesses.
- Lowering mortgage rates to record lows: Mortgage rates now stand at approximately 4.3%, down from 5.2% last year, as China aims to boost real estate activity amid a 20% drop in property sales year-over-year.
- Injecting $142 billion into banks: By injecting this capital, the PBOC hopes to stabilize financial institutions and ensure they can continue extending credit to support economic activity.
- Implementing "forceful" rate cuts: As part of broader monetary easing, the central bank cut key rates by 0.25%, representing its most significant intervention in three years.
Despite these measures, China’s GDP-to-debt ratio has continued to rise, reaching an estimated 290% in 2024, compared to 260% five years ago. This mirrors Japan’s pre-stagnation trajectory, which saw the measure climbing from 150% in the 1980s to over 250% by the early 2000s. Without more effective structural reforms, China may face similar difficulties in achieving long-term sustainable growth.
The Debt Trap
China’s fiscal stimulus has rapidly increased public and corporate debt levels, now totalling nearly 290% of GDP. A closer look at debt composition shows that local governments account for over $9 trillion, while corporate debt exceeds $20 trillion, making China’s corporate sector one of the most indebted in the world. In comparison, Japan’s total debt-to-GDP ratio hit similar levels just before its asset bubble burst, leading to a prolonged period of stagnation.
Moreover, debt-financed projects in China—particularly in infrastructure and real estate—account for nearly 45% of recent economic activity. Yet, evidence suggests diminishing returns. For instance, local governments have invested heavily in underutilized infrastructure, with reports showing up to 10% of new developments remain unoccupied or “ghost cities.”
A comparison of debt growth between China and Japan demonstrates the risks: in the late 1980s, Japan’s debt-financed infrastructure projects offered initial economic boosts but eventually led to debt strains and slow growth. China’s dependence on similar spending suggests a growing risk of debt-induced stagnation.
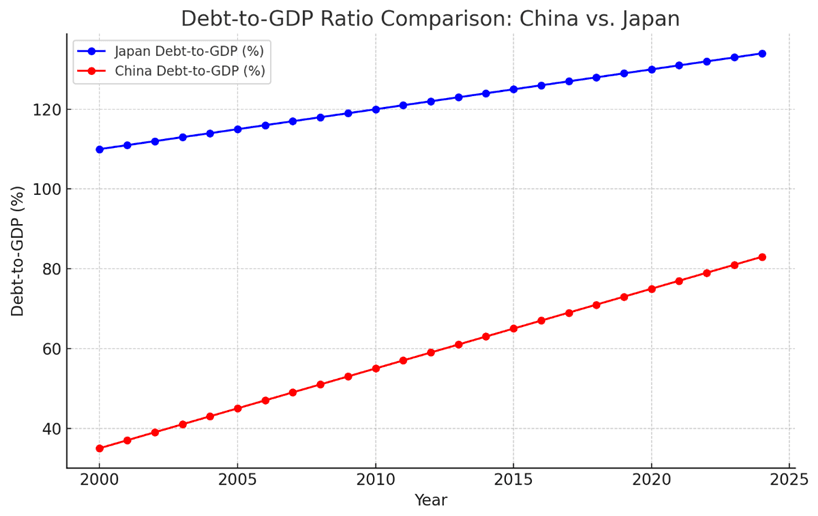
This chart illustrates the Debt-to-GDP ratio for both China and Japan from the year 2000 to 2025. The ratio measures the size of a country's debt compared to its Gross Domestic Product (GDP), and it’s an important indicator of economic stability.
- Japan (in blue): Japan’s ratio starts above 100% in 2000 and continues to rise steadily, reaching over 120% by 2025. This trend reflects Japan’s long-standing high debt levels, partly due to decades of economic stagnation, high public spending, and an aging population, which increases pressure on social welfare systems.
- China (in red): China’s ratio starts much lower, at around 40% in 2000, but grows steadily throughout the period, reaching around 80% by 2025. This increase can be attributed to China’s heavy reliance on debt-financed investments in infrastructure and real estate, which has driven economic growth but also raised concerns about debt sustainability.
The comparison highlights that while Japan has traditionally carried a high ratio, China’s debt levels are increasing rapidly, potentially signalling a convergence in their economic vulnerabilities.
Aging Population
Japan’s “lost decade” coincided with a rapidly aging population, which reduced labour force growth and consumer demand. China faces similar demographic pressures, with projections indicating a shrinking workforce and an elderly population set to reach 30% by 2050, up from 15% today. This demographic shift could undermine the effectiveness of China’s fiscal stimulus in the long term.
Additionally, China's population decline began sooner than anticipated. In 2023, China’s population contracted for the first time in over six decades, marking a historic demographic shift. Currently, China’s birth rate is around 1.3 children per woman, well below the replacement rate of 2.1, suggesting continued population decline.
The economic implications of this aging demographic are profound. By 2035, the ratio of working-age individuals to retirees in China is projected to fall to 3:1, compared to 6:1 in 2000. This will may lead to slower consumption growth, increased government spending on pensions and healthcare (currently at 12% of GDP and projected to rise), and a decrease in overall economic productivity.
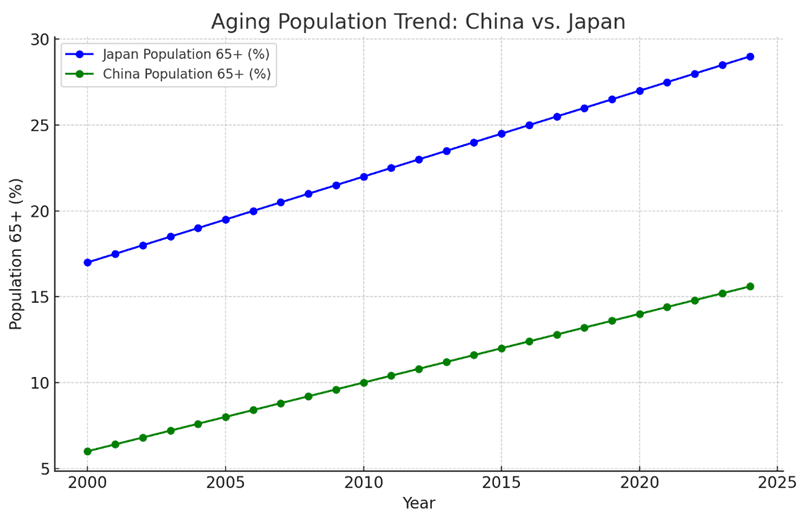
This chart compares the percentage of the population aged 65 and older in China and Japan from 2000 to 2025. The aging population is a critical factor affecting economic growth, healthcare costs, and social welfare.
- Japan (in blue): Japan shows a steep increase in the 65+ population, rising from just under 20% in 2000 to nearly 30% by 2025. This reflects Japan’s demographic challenges, with one of the world’s highest proportions of elderly citizens, which has contributed to labor shortages and increased government spending on healthcare and pensions.
- China (in green): China’s 65+ population also increases steadily, starting at around 5% in 2000 and approaching 15% by 2025. While still lower than Japan, this upward trend indicates that China, too, faces a rapidly aging population, a challenge exacerbated by the former one-child policy. This demographic shift could slow economic growth in the long term as the working-age population shrinks.
In both countries, the aging population trend suggests an economic burden due to increased healthcare and pension needs, potentially limiting fiscal flexibility in the future.
Global Implications
China’s slowdown carries major global implications, especially for commodities and manufacturing. As the world’s largest consumer of raw materials, China’s reduced demand has already affected commodity prices, with iron ore and copper prices dropping by 15% and 8%, respectively, over the past year. Should China’s economy stagnate further, other commodity-dependent countries like Australia and Brazil could experience significant revenue declines.
In addition, China’s shift towards state-backed enterprises and increased government intervention has introduced inefficiencies that may dampen its global competitiveness. Multinational corporations with significant exposure to China—such as Apple, Volkswagen, and HSBC—are closely watching these shifts, with many signalling potential relocations of their supply chains. Already, U.S. foreign direct investment in China fell by 25% from 2022 to 2023, indicating a re-evaluation of China’s market potential among global investors.
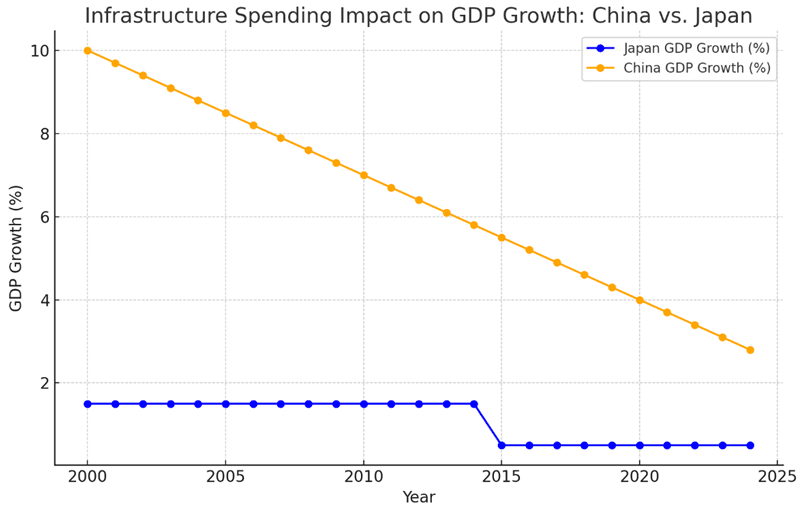
This chart shows the GDP growth rates for China and Japan, highlighting the impact of infrastructure spending on their economic growth trajectories.
- Japan (in blue): Japan’s GDP growth remains almost flat, hovering around 2% over the entire period, with a slight dip around 2015. This reflects Japan’s "Lost Decade(s)"—a prolonged period of economic stagnation that followed the asset bubble burst in the early 1990s. Despite substantial infrastructure spending, Japan has struggled to achieve strong economic growth, likely due to structural issues and an aging population.
- China (in orange): China’s GDP growth starts high, at around 10% in 2000, but gradually declines over the years, dropping to around 3% by 2025. This decrease suggests diminishing returns on infrastructure investments and slowing growth as the economy matures. China's declining growth rate also reflects challenges such as rising debt levels, an aging population, and a shift away from an export-led growth model.
This chart demonstrates how infrastructure spending can initially fuel economic growth, as seen in China, but may eventually lead to diminishing returns, as both China and Japan face structural economic issues that limit long-term growth.
Conclusion
China’s current fiscal stimulus bear a resemblance to Japan’s pre-stagnation period, yet it remains uncertain whether China will avoid a similar fate. Without critical reforms addressing its debt burden, aging population, and productivity issues, China risks prolonged economic stagnation. For global markets, the stakes are high, and the world will be watching closely to see how China navigates this pivotal juncture in its economic trajectory.
Sources:
View the hedge fund managers on our platform that are seeking opportunities in China and build customized alternative investment portfolios for your clients.
For financial advisors only.