
Published on March 28, 2025
Historical Signals Point to Increased Market Breadth
2024 ended with historic market concentration as the Magnificent 7 ended the year making up one-third of the S&P 500.1 Big tech has gotten bigger, leaving other sectors and cap weightings in the dust. However, big tech’s dominance could be set to cool off as historical signals point to a broadening market breadth. With rate cuts expected in 2025, monetary easing has historically coincided with the outperformance of equal weight market indices vs their market cap weighted peers and rising market breadth. Further, equal weight market indices are trading at a large discount to their cap-weighted counterparts while boasting higher earnings growth expectations. Historical signals such as monetary easing, growth expectations, record concentration and current pricing are signaling that the “average” stock will outperform in 2025 as equal weight indices best their highly concentrated market cap weighted peers.
Easing Concentration, More Market Breadth
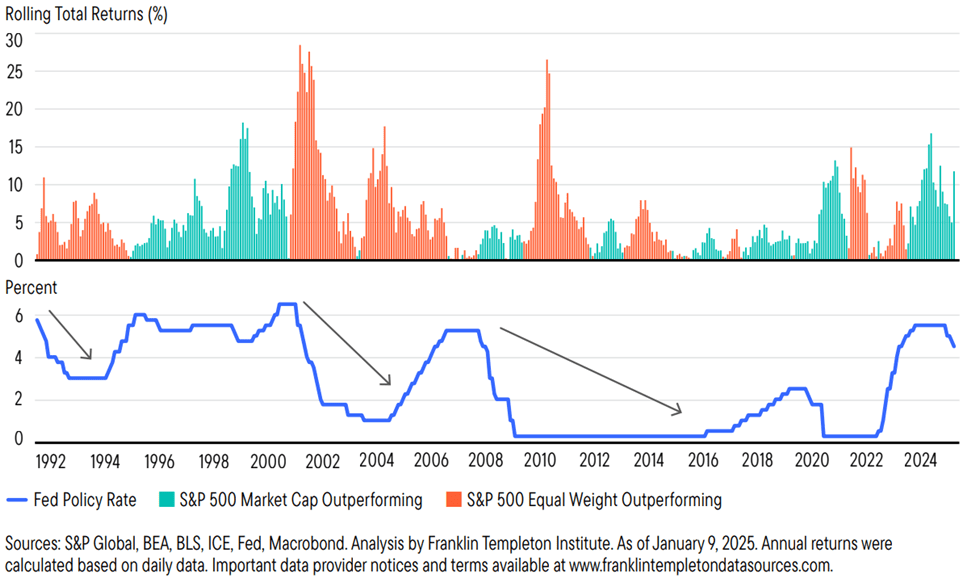
Periods of equal weight index outperformance vs their market cap-weighted peers and widening market breadth have historically coincided with loosening monetary policy.2 There are two main drivers of stock market performance; earnings and liquidity. Earnings are tied to the economy, while liquidity is a function of monetary and fiscal policy. Monetary policy has been easing, which leads to more liquidity. 2024 saw 150 rate cuts globally across central banks and there are more expected in 2025. Over the past 30 years, every period of equal weight index outperformance vs their market cap-weighted peers and rising market breadth has coincided with a loosening monetary policy. This outperformance kicks into high gear shortly after the start of a rate-cutting cycle as seen in 1991, 2001, and 2009. Interest rates in the U.S. have already dropped by a point since the Fed began cutting rates and market participants expect at least one more cut in 2025 with the potential for multiple cuts.3
S&P Performance During Fed Policy Rate Changes
Source: Franklin Templeton. January 2025. “Get ready for a broader US equity market”
Tomorrow’s Growth Worth More Today
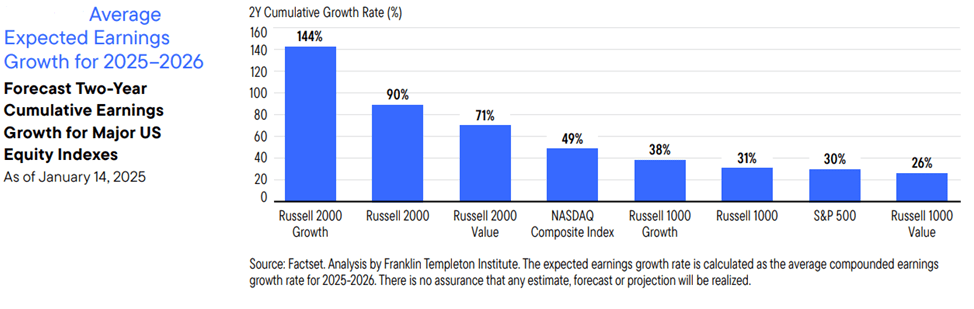
Equal weight indices tend to outperform and market breadth tends to rise during periods of declining interest rates. When rates are falling, expected earnings in the future are discounted less and become more valuable today. Therefore, parts of the market that are expecting the highest level of earnings growth should benefit the most from falling interest rates through the lens of a discounted cash flow method. While EPS growth expectations are high across the market, expectations among small and mid-cap stocks stick out. The compounded growth rate of the Russell 2000 over the next two years is 90% vs. 49% for the NASDAQ and 30% for the S&P 500.2
Forecast Earnings Growth For Major US Equity Indices
Source: Franklin Templeton. January 2025. “Get ready for a broader US equity market”
The Magnificent Discount
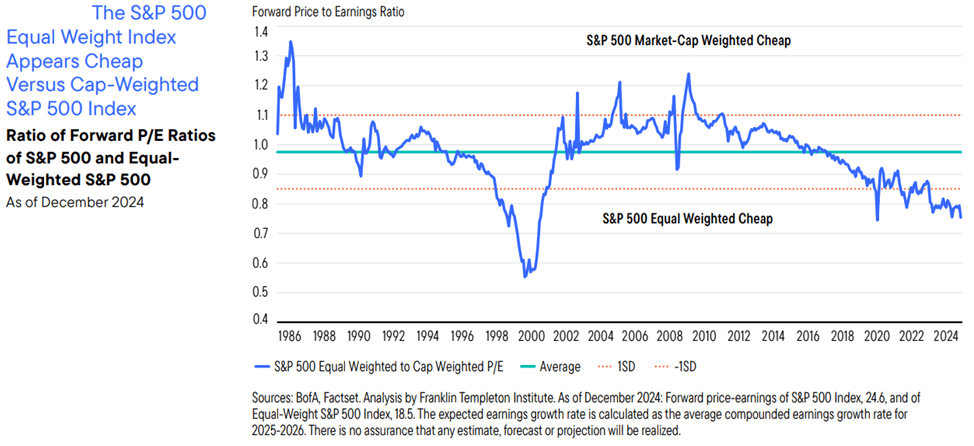
Future growth expectations favor small and mid-cap stocks, and current valuations also favor names outside of the highly concentrated S&P 500.2 The S&P 500 Equal weighted index is the cheapest it has been on an earnings basis vs. the S&P 500 since the dot com bubble. While mega-cap stocks and the Magnificent 7 have demonstrated strong underlying fundamental performance, historical analysis suggests that the “average” stock and their broader market counterparts are priced to outperform, increasing market breadth.
Forward P/E Ratios
Source: Franklin Templeton. January 2025. “Get ready for a broader US equity market”
Seven Stocks, 1/3 of the S&P 500
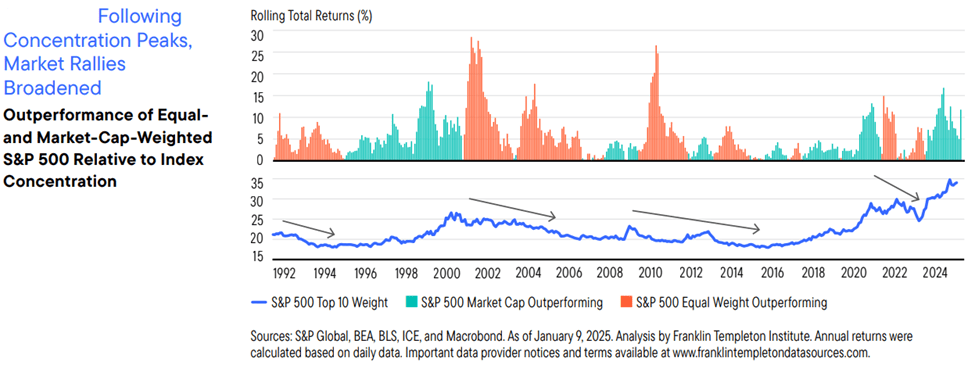
Equal weighted indices are priced at a considerable discount to their market cap-weighted peers, and this discount has come with record market concentration and low market breadth. As mega cap big tech names dominated global markets, the Magnificent Seven currently make up roughly one-third of the S&P 500.1 Historically, market concentration peaks have preceded broadening market participation and outperformance among equal weighted indices and the average stock, unwinding the concentration and increasing market breadth.
Market Rallies Following Concentration Peaks
Source: Franklin Templeton. January 2025. “Get ready for a broader US equity market”
The Magnificent 7 currently make up roughly one-third of the S&P 500, marking a historic level of stock market concentration.1 The concentration has come on the back of big tech names dominating global markets over the last year. Skeptics have been calling the top for years as big tech kept rolling and the “expensive” mega-caps reached new heights. While the magnificent 7 could keep dominating, history suggests market breadth will widen.2 Key signals indicate that the concentration is at or near its peak and that the strength of the market will spread across different sectors and market cap sizes as equal weight indices begin to outperform their market cap weighted peers. Over the past 30 years, every period of equal weight index outperformance vs their market cap-weighed peers and rising market breadth has coincided with a loose monetary policy. This outperformance of the average stock picks up shortly after the start of a cutting cycle, as evidenced in 1991, 2001, and 2009. When rates are falling, earnings growth into the future is discounted less and becomes more valuable today. The compounded growth rate of the Russell 2000 over the next two years is 90% vs. 49% for the NASDAQ and 30% for the S&P 500. Lastly, the average stock is cheap as the S&P 500 Equal weighted index is the least expensive it has been on an earnings basis vs. the S&P 500 since the dot com bubble. Historical signals such as monetary easing, growth expectations, record concentration and current pricing all point to the dominance of the mega cap tech stocks subsiding and the average stock outperforming in 2025.
Sources:
There are several avenues for individual investors to invest in a broadening market rally, however, these require due diligence and professional guidance.
For financial advisors only.