
1.7 vs 0.5
5-Year Sharpe Ratio
Hedge Funds vs 60/40*
+18.64%
HFRI Composite, 12 mo.
Through May 2026
2.76%
5-Yr HF Volatility
vs 9.59% / 10.92% for 60/40
$5.22T
Global HF AUM
Record — 1Q26
Sources: BNP Paribas Capital Introduction, 2026 Hedge Fund Outlook; HFR, HFRI Monthly Indices Flash Update, May 2026 (June 5, 2026); HFR Global Hedge Fund Industry Report, 1Q 2026; Vanguard Balanced Index Fund (VBIAX) and iShares Core 60/40 Balanced Allocation ETF (AOR), fund-provider and Morningstar data. *Hedge Funds vs a U.S. 60/40 portfolio (VBIAX); the global 60/40 (AOR) five-year Sharpe is ≈0.4. Volatilities are annualized monthly standard deviations. Sharpe ratios computed by Crystal Capital Partners from cited inputs; see Methodology Notes. Past performance is not indicative of future results.
EXECUTIVE SUMMARY
The question is not who posted the largest number — it's who delivered the most return per unit of risk.
The right question for an allocation decision is not which asset class posted the largest number last year, but which delivered the most return per unit of risk taken — because an allocator's binding constraint is risk budget, not headline performance. Measured that way, against the balanced 60/40 portfolio that anchors most client allocations, hedge funds have delivered higher risk-adjusted returns over the period analyzed. Over the trailing five years hedge funds delivered an implied Sharpe ratio of roughly 1.7, against roughly 0.5 for a U.S. 60/40 portfolio and roughly 0.4 for a global 60/40 — higher risk-adjusted returns over the period analyzed, based on the methodology described, with lower reported volatility than the 60/40 benchmarks.
THREE COMPOUNDING RISKS INSIDE THE 60/40
That risk-adjusted lens matters more now than at any point in the past two decades, because the traditional 60/40 portfolio is quietly carrying three measurable, compounding risks at once.
01 — CONCENTRATION
The ten largest stocks now represent roughly 41% of S&P 500 weight — the highest in decades — and, more importantly, contribute more than half of the index's total volatility.
02 — CORRELATION
The 60-day correlation between U.S. stocks (SPY) and the U.S. bond aggregate (AGG) stands at +0.70, within two points of its highest reading in more than twenty-two years of data. The hedge has become the exposure.
03 — DURATION
The bond sleeve carries roughly 30% more interest-rate sensitivity than it did twenty years ago, well above its long-run average — more rate risk, at precisely the moment its diversification benefit has disappeared.
MAY EXTENDS THE ADVANCE — BUT THE SHAPE IS THE POINT
Hedge funds extended their advance in May — the HFRI Fund Weighted Composite gained +1.65%, reaching +7.14% year-to-date and +18.64% over the trailing twelve months — but the monthly print is not the point. The point is the shape of those returns: their drivers — manager skill, arbitrage, event catalysts — are structurally independent of the single macro factor a 60/40 investor now effectively owns twice.
ONE CAVEAT GOVERNS EVERYTHING THAT FOLLOWS
The index averages in this report describe a universe in which the spread between top-decile and bottom-decile managers reached 58.6 percentage points in 2025 alone. In this category, access is necessary but not sufficient. The manager you select defines the result.
01 — Performance
May 2026: Hedge Fund Industry Performance and the Risk-Adjusted Case
All figures: HFRI Fund Weighted Composite
+1.65%
MAY 2026
+7.14%
YEAR-TO-DATE
+18.64%
TRAILING 12 MONTHS
+12.18%
3-YR ANNUALIZED
Hedge funds extended their advance in May. The HFRI Fund Weighted Composite added +1.65%, lifting year-to-date performance to +7.14% and the trailing twelve-month return to +18.64%. The three-year record now stands at +41.18% cumulative, a +12.18% annualized rate. The asset-weighted composite — in which the largest funds dominate the result, a more conservative institutional lens — returned +1.63% in May and +15.03% over the trailing year.
"The extreme opposite of a passive beta equity index exposure market cycle."
KENNETH J. HEINZ, PRESIDENT • HFR
THREE DRIVERS SHAPED THE MONTH
01 TECHNOLOGY & AI
+10.63%
HFRI EQUITY HEDGE: TECHNOLOGY
Far outpaced the broader Equity Hedge composite at +2.70%. Goldman Sachs Prime Services reports the average equity long/short fund up roughly +7% YTD, with technology the dominant contributor.
02 COMMODITIES REVERSAL
−19%
BRENT CRUDE — WORST MONTH SINCE 2020
Progress toward a U.S.–Iran ceasefire unwound April's spike toward $138 per barrel, pulling the HFRI Macro: Commodity sub-index to −1.09% even as equity strategies advanced.
03 EVENT-DRIVEN BUILD
+4.84%
ACTIVIST SUB-STRATEGY
Event-Driven gained +2.07% overall as managers positioned for a potentially record IPO calendar in H2 — anchored by SpaceX and OpenAI — while Warsh's Fed confirmation removed key policy uncertainty.
HFRI MONTHLY INDICES
| Index | May 2026 | YTD | 1 Year |
|---|---|---|---|
| HFRI Fund Weighted Composite | +1.65% | +7.14% | +18.64% |
| HFRI Equity Hedge (Total) | +2.70% | +8.92% | +24.14% |
| HFRI Event Driven (Total) | +2.07% | +5.75% | +15.07% |
| HFRI Macro (Total) | +0.17% | +7.50% | +18.12% |
| HFRI Relative Value (Total) | +0.60% | +3.58% | +8.75% |
Source: HFR, HFRI Monthly Indices Flash Update, May 2026 (June 5, 2026). HFRI figures are flash update estimates subject to revision in subsequent HFRI updates. Past performance is not indicative of future results.
Beneath the composite, the month told a sharper story. Within a single strategy label — Equity Hedge — the Technology sub-index gained +10.63% while Healthcare lost −2.04%: a 12.67-point spread inside one strategy, in one month. Over the trailing twelve months the leadership flips entirely, with Healthcare up +45.70% against Technology's +35.83%. The strategy label on the door tells an allocator very little; the fund behind the door tells them everything.
THE REAL SCOREBOARD
Return per unit of risk.
IMPLIED SHARPE — 5-YR ANNUALIZED, THROUGH 2025
HFRI FUND WEIGHTED COMPOSITE
≈ 1.7
HEDGE FUNDS
VANGUARD BALANCED INDEX (VBIAX)
≈ 0.5
U.S. 60/40
ISHARES CORE 60/40 (AOR)
≈ 0.4
GLOBAL 60/40
A strong month is not the argument; the shape of the returns is. An allocator's binding constraint is risk budget, not capital. Benchmarked against a diversified 60/40 portfolio — a fairer comparison than pure equities — hedge funds have delivered higher risk-adjusted returns over the period analyzed.
Over the trailing five years — a window spanning a full rate-hiking cycle and multiple market dislocations — hedge funds earned 466 bps annualized over cash at just 2.76% volatility. Both 60/40 portfolios matched or trailed hedge funds on absolute return, with materially higher reported volatility, during a period that included the 2022 dual stock-bond drawdown, a geopolitical oil spike, tariff volatility, and a contested Fed transition.
WHY IT MATTERS
A return stream earned at a fraction of the volatility has historically exhibited greater resilience in drawdowns than a beta-driven one — though hedge funds carry significant risks, including the potential for material loss of principal, and this pattern may not persist.
FIVE-YEAR ANNUALIZED, THROUGH 2025
| Hedge Funds | US 60/40 (VBIAX) | Global 60/40 (AOR) | |
|---|---|---|---|
| Total return (ann.) | 7.96% | 7.91% | 7.13% |
| Excess return over cash | +4.66% | +4.61% | +3.83% |
| Volatility (ann. monthly) | 2.76% | 9.59% | 10.92% |
| Implied Sharpe ratio | ≈ 1.7 | ≈ 0.5 | ≈ 0.4 |
Sources: hedge fund returns over cash and volatility — BNP Paribas Capital Introduction, 2026 Hedge Fund Outlook (survey of 246 allocators representing $1.1T in hedge fund assets); U.S. 60/40 — Vanguard Balanced Index Fund (VBIAX), global 60/40 — iShares Core 60/40 Balanced Allocation ETF (AOR). Five-year standard deviations per Morningstar (annualized monthly). Cash rate of 3.30% (five-year average) applied uniformly. Sharpe ratios computed by Crystal Capital Partners as excess return over cash divided by volatility; figures are illustrative, not official statistics. Past performance is not indicative of future results.
02 — Three Risks
Three Risks Inside the Traditional Portfolio
An investor in a standard 60/40 is, in practice, running a concentrated mega-cap technology bet, hedged with an asset that now moves with equities and carries elevated rate risk of its own.
CONCENTRATION (THE '60')
~41%
TOP-10 SHARE OF S&P 500 WEIGHT
Top 10 stocks > 41% of S&P 500 weight and > 50% of its volatility; effective independent bets: 54 of 503 constituents.
CORRELATION (THE '60' VS THE '40')
+0.70
AGG / SPY 60-DAY CORRELATION
Within two points of its highest level since the data series began in December 2003.
DURATION (THE '40')
5.79 yrs
BLOOMBERG U.S. AGGREGATE DURATION
Vs a 4.98-year long-run average and ~4.5 years in 2006 — ~30% more rate sensitivity than two decades ago.
RISK NO. 1 — CONCENTRATION
The S&P 500 Is No Longer a 500-Stock Bet
The ten largest constituents of the S&P 500 now account for roughly 41% of the index's weight — the highest level in decades, and more than double their share from the mid-2010s, when the top ten represented 18–23% of the index. The Magnificent Seven alone represent approximately 35–40% of total index capitalization. One widely cited measure puts the effective number of independent bets in the index at just 54 of its 503 constituents. An investor holding a standard cap-weighted S&P 500 fund is not holding the broad market; they are holding a concentrated mega-cap technology position with an index label on it.
Weight, however, understates the problem. The more important measure is risk contribution. Research published by a leading quantitative investment manager in January 2026, using S&P Global and LSEG data, found that the ten largest stocks now contribute more than 50% of the S&P 500's total volatility — and that the group's aggregate volatility runs roughly 1.5 times that of the index as a whole, with a market beta well above 1.0. That is a structural change from the early 2010s, when the largest names were a diverse set of lower-volatility blue chips — Apple alongside ExxonMobil and Johnson & Johnson — whose risk contribution sat below their index weight. Today's top ten are concentrated in correlated, technology-linked businesses, several of them among the most volatile large stocks in the market. The same research documents the knock-on effect: the distribution of betas inside the index has fractured, with nearly 20% of index weight in stocks carrying a beta below 0.5 and over 15% in stocks with a beta above 2.0 as of end-2025. The 'market portfolio' has become a barbell.
Honesty requires the counterpoint: this is not a simple replay of 1999. In the dot-com run-up, the weight of the largest stocks expanded while their share of earnings stayed flat — a pure multiple expansion. In the current episode, the earnings share of the largest companies has risen alongside their weight; a meaningful portion of the growth being priced has actually been delivered. But that cuts both ways. Because the concentration is partially earnings-supported, it is unlikely to unwind quickly; for the top-ten weight to revert to its pre-2020 average of roughly 21%, the other ~490 stocks would need to return more than 160% with the largest names flat. Concentration is not a temporary anomaly investors can wait out; it is the operating environment. And it is an expensive one: the top-ten stocks carry roughly 41% of index weight against roughly 32% of index earnings, the cap-weighted index trades at a nearly 30% premium to its equal-weighted counterpart, and Goldman Sachs estimates the S&P 500 will return approximately 3% annually over the coming decade.
Concentration is not only a risk to bear; it is an inefficiency to exploit — and that is where a hedge fund allocation may play a role in portfolio construction. The same concentration that degrades the index as a passive holding also mechanically handicaps long-only active managers: under a long-only constraint, a manager's largest possible underweight in any stock is that stock's index weight, and the share of S&P 500 names big enough to express a meaningful underweight (≥ 50 bps) has fallen from roughly 10% in 1997 to about 6% today. Concentration thus transfers alpha potential away from long-only mandates and toward managers who can short. Goldman Sachs data shows the typical hedge fund running roughly 72% of its long book in its top ten positions — concentrated where it has conviction, hedged where it does not. A long/short allocation is not merely a diversifier in a concentrated market; it may be better positioned to express these dynamics.
RISK NO. 2 — CORRELATION
The Hedge Has Become the Exposure
The case for the 40% bond sleeve was never primarily about yield; it was about correlation. From the mid-1980s through 2021, stocks and bonds reliably moved in opposite directions, and that negative correlation was the mechanical foundation of the 60/40 model. The relationship broke decisively in 2022, when the Bloomberg U.S. Aggregate fell 13.01% — its worst annual return on record — in the same year equities sold off sharply, handing a typical 60/40 portfolio a roughly 17.5% drawdown, its worst year since 1937.
The breakdown was not a one-year accident. As of June 9, 2026, the 60-day rolling correlation between the iShares Core U.S. Aggregate Bond ETF (AGG) and the S&P 500 ETF (SPY) stands at +0.70 — within two points of the highest reading (+0.72) in the entire data series going back to December 2003, a span that covers the global financial crisis, the 2013 taper tantrum, the 2020 pandemic shock, and the 2022 repricing. For most of those two decades the same measure was negative, frequently below −0.50. The IMF and multiple institutional research teams attribute the regime change to a structural shift: the reliably negative correlation of 1985–2021 was a product of falling inflation and falling rates. In a regime of persistent inflation risk, heavy sovereign issuance, and structurally higher neutral rates, stocks and bonds can remain positively correlated for extended periods. When both sleeves move together, the 40% allocation is not a diversifier — it is additional exposure to the same macro factor, dressed in safer clothing.
60-Day Correlation between AGG and SPY
iShares Core U.S. Aggregate Bond ETF vs S&P 500 ETF — rolling correlation of total returns
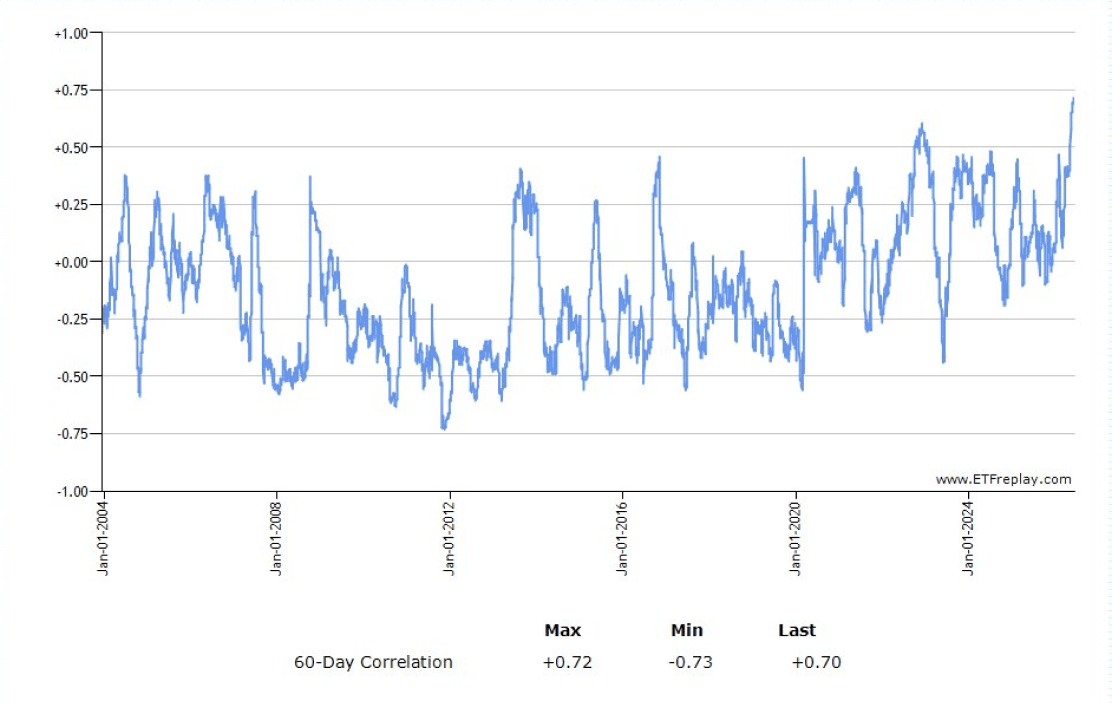
ETFreplay.com — AGG vs SPY 60-day rolling correlation of total returns, December 15, 2003 – June 9, 2026. Series maximum +0.72, minimum −0.73, latest +0.70. ETF total-return correlation is shown as a proxy for the underlying stock and bond indices. Chart is a representation of the cited series; correlations are not static and may change materially over time.
RISK NO. 3 — DURATION
More Rate Sensitivity, Exactly When It Hurts
The third risk compounds the second. The duration of the Bloomberg U.S. Aggregate Bond Index — the standard proxy for the '40' — stood at 5.79 years as of March 2026, against a long-run average of 4.98 years and roughly 4.5 years in 2006. The benchmark bond sleeve therefore carries approximately 30% more interest-rate sensitivity than it did twenty years ago, and remains well above its historical norm even after declining from its 2021–2022 peak. As a first-order approximation, a portfolio with 5.8 years of duration loses roughly 5.8% of its value for every one-percentage-point parallel rise in rates, before income offsets.
Each risk in isolation is manageable. The combination is the problem. Elevated bond duration makes the 40% sleeve more sensitive to rates and inflation — and that same variable reaches the equity sleeve through an identical channel. A stock is worth the present value of its future cash flows, so when most of that value sits in distant, terminal-year cash flows, the equity behaves like a long-duration asset whose price falls as discount rates rise. The concentrated mega-cap growth names that now dominate the index (Risk No. 1) are precisely the longest-duration equities, which is a central reason stocks and bonds have begun to fall together: the index's tilt toward them has effectively lengthened the equity sleeve's own rate sensitivity. Duration risk, in other words, is not confined to the 40%; it runs through both sleeves. With the 10-year Treasury at 4.54%, AGG roughly −0.5% year-to-date through late May, and a Federal Reserve positioned for at most one further cut this year, a 60/40 investor today is effectively long one macro factor — rates — twice over, with extra duration attached.
03 — Record AUM
The Hedge Fund Industry Reaches Record AUM
Institutional capital is not waiting for the academic debate to settle. Global hedge fund industry AUM reached a record $5.22 trillion at the end of 1Q26 — the fourteenth consecutive quarterly increase — on net inflows of $44.5 billion in the quarter and $89.3 billion over two quarters, the highest two-quarter total since 2007. Barclays' 2026 survey of 340+ investors representing $7.8 trillion reports the strongest hedge fund inflow intentions in nearly two decades; BNP Paribas finds 64% of allocators planning to increase exposure in 2026. Both surveys cite the same rationale: liquid, lower-correlation return streams at a time of stretched equity valuations — precisely the role fixed income no longer reliably plays.
$5.22T
Global HF AUM — record, 14th straight quarterly high
$89.3B
Two-quarter inflows — highest since 2007
$44.5B
Net inflows, 1Q26
64%
Allocators planning to raise HF exposure in 2026
Sources: HFR Global Hedge Fund Industry Report, 1Q 2026 (latest available; 2Q 2026 not yet published); Barclays 2026 Hedge Fund Outlook; BNP Paribas Capital Introduction, 2026 Hedge Fund Outlook. Past performance is not indicative of future results.
04 — Second Half 2026
The Hedge Fund Industry Positions for the Second Half of 2026
The conditions behind these results are structural, not episodic. The late-2010s era of hedge fund industry underperformance was built on compressed dispersion — zero rates, synchronized growth, passive beta capturing everything. 2022–2026 has inverted each of those conditions: rates are positive, dispersion within and across markets has widened, geopolitics generates repeated regime-change events, and AI is producing winner-take-most dynamics that skilled managers can trade on both sides of the book.
Cambridge Associates describes the environment — elevated dispersion, low correlations, policy uncertainty — as structurally favorable for long/short managers; Wellington reaches the same conclusion for hedge fund allocations broadly. Three specific second-half catalysts stand out: an expected record IPO calendar (directly supportive of event-driven and activist strategies), the policy clarity following the Warsh Fed confirmation, and a cleaner macro environment as April's oil distortion unwinds.
None of that depends on equities going up — only on markets continuing to differentiate. But differentiation cuts both ways: the same forces that reward skilled managers widen the gap between the best and worst funds, which makes capturing this environment less a question of access to hedge funds than of selecting the right ones.
Selection, not access, determines the outcome — and that is precisely the discipline a curated platform is designed to support.
SEE HOW CRYSTAL'S PLATFORM IS BUILT FOR THIS ENVIRONMENT
Advisors on the platform gain access to a curated roster of institutional private equity, private credit, and hedge fund exposures, backed by independent due diligence, portfolio construction support, and client-ready educational materials — delivered through reduced investment minimums, a single streamlined subscription document, and consolidated reporting. Everything required to allocate to alternatives with institutional rigor and operational ease.
METHODOLOGY NOTES, IMPORTANT CONSIDERATIONS & RISK FACTORS
Sharpe ratio methodology. Implied Sharpe ratios are computed by Crystal Capital Partners as excess return over cash divided by volatility, on a monthly-return basis, using only the cited inputs. The cash rate is 3.30% (five-year average), derived from the report's HFRI excess-over-cash figures and applied uniformly to all three return streams. Five-year annualized returns and volatilities: hedge funds 7.96% at 2.76% (BNP Paribas Capital Introduction, 2026 Hedge Fund Outlook); U.S. 60/40, Vanguard Balanced Index Fund (VBIAX), 7.91% at 9.59%; global 60/40, iShares Core 60/40 Balanced Allocation ETF (AOR), 7.13% at 10.92%. Volatilities are annualized monthly standard deviations (Morningstar/provider). Fund returns are net of fund expenses and hedge fund survey returns are net of fees. These computations are illustrative and are not official statistics of HFR, BNP Paribas, Vanguard, or BlackRock.
Stock-bond correlation. The +0.70 figure is the 60-day rolling correlation of total returns between AGG and SPY per ETFreplay.com as of June 9, 2026; the data series begins December 15, 2003 (series maximum +0.72, minimum −0.73). ETF total-return correlation is a proxy for the underlying indices and reflects a short 60-day measurement window; longer-window correlations will differ, and correlations change over time.
Duration. Index duration figures reflect the Bloomberg U.S. Aggregate Bond Index (5.79 years as of March 31, 2026), per Hartford Funds using Barclays Live/Bloomberg data; long-run average 4.98 years; approximately 4.5 years in 2006 per LCG Associates/Bloomberg. Index duration peaked above current levels in 2021–2022 before declining; the comparison in this report is against the 2006 level and the long-run average, not a claim of an all-time high. The statement that a 1% rate rise implies an approximate 5.8% price decline is a linear-duration approximation that ignores convexity and income.
Index and category limitations. Performance data reflects index-level results and does not represent any fund or portfolio managed by or available through Crystal Capital Partners. HFRI indices are subject to survivorship and backfill biases inherent in hedge fund databases; reported returns may overstate the investable universe. HFRI May 2026 figures are Flash Update estimates subject to revision. Capital and flow figures reflect the HFR Global Hedge Fund Industry Report, 1Q 2026, the latest available. Reported hedge fund volatility reflects NAV-based reporting, which may understate economic risk due to smoothing, illiquidity, and stale pricing; the true risk profile of underlying strategies is not fully captured by the volatility and Sharpe figures cited. Concentration metrics (effective bets, HHI-based measures) are model-dependent and vary by provider.
Hedge fund risks. Hedge fund investments involve significant risks, including illiquidity and lock-ups, leverage (which amplifies gains and losses), short-selling risk, concentration risk, manager-specific risk, and the potential loss of the entire investment. Comparisons between hedge fund indices and AGG or equity indices do not account for differences in liquidity, fees, minimums, or the range of individual fund outcomes. A bond allocation may serve functions — liability matching, current income, regulatory requirements — that a hedge fund allocation does not replicate. Past performance is not indicative of future results.
SOURCES
Primary Performance Data
HFR, HFRI Monthly Indices Flash Update, May 2026 (June 5, 2026); HFR press release, "HFRI Extends Surge in May on Technology and AI Optimism," June 5, 2026; HFR, HFRI Defined Formulaic Methodology, 2026 (v.2026.01.15).
Industry Capital and Flows
HFR Global Hedge Fund Industry Report, 1Q 2026.
Risk-Adjusted Return Inputs
BNP Paribas Capital Introduction, 2026 Hedge Fund Outlook (246 allocators, $1.1T in hedge fund assets; hedge fund returns over cash and volatility); Vanguard Balanced Index Fund (VBIAX) — U.S. 60/40 benchmark — calendar and trailing returns per Vanguard, five-year standard deviation per Morningstar; iShares Core 60/40 Balanced Allocation ETF (AOR) — global 60/40 benchmark — calendar and trailing returns per iShares fact sheet (March 31, 2026), five-year standard deviation per Morningstar.
Equity Market Concentration
Research published by a leading quantitative investment manager, "The Concentration Game," February 2026 (underlying data: S&P Global Market Intelligence; LSEG Data & Analytics; MSCI; Bloomberg) — source document on file with Crystal Capital Partners; RBC Wealth Management / FactSet, "The Great Narrowing," January 2026; AhaSignals ACRI (SSGA SPY holdings), April 13, 2026; Columbia Threadneedle, September 2025; Guinness Global Investors, October 2025; Goldman Sachs 10-year forward return estimate; S&P Dow Jones Indices, U.S. Equal Weight Sector Dashboard, April 30, 2026.
Stock-Bond Correlation and Fixed Income
ETFreplay.com, AGG vs SPY 60-day rolling correlation, December 15, 2003 – June 9, 2026 (accessed June 9, 2026); Bloomberg U.S. Aggregate Bond Index historical returns; iShares Core U.S. Aggregate Bond ETF (AGG), BlackRock, YTD total return as of May 26, 2026; Hartford Funds, "Are You Prepared for Duration Risk?" Q2 2026 (Barclays Live / Bloomberg); LCG Associates, "Bloomberg Aggregate: Then and Now," March 2024; Charles Schwab, 2026 Taxable Fixed Income Mid-Year Outlook, June 5, 2026; Trading Economics, U.S. 10-Year Treasury Yield, June 9, 2026; IMF / Economic Perspectives, February 2026; Landmark Wealth Management / Bloomberg / FactSet / J.P. Morgan, 60/40 return decomposition, March 2026.
Allocator Surveys and Corroboration
Barclays 2026 Hedge Fund Outlook (340+ investors, $7.8T); BNP Paribas Capital Introduction, 2026 Hedge Fund Outlook; Goldman Sachs Prime Services / Prime Insights & Analytics, 2026.
Manager Dispersion
HFR / Hedgeweek, April 2026 (2025 full-year manager decile dispersion).
Portfolio Construction Research
Cambridge Associates, "2026 Outlook: Diversifier Views," February 19, 2026;
Wellington Management, "2026 Hedge Fund Outlook," December 2025.
Market Context
CNBC, May 2026; International Energy Agency, May 2026; Man Group, Q2 2026 Hedge Fund Strategy Outlook; HFR liquid-alternative UCITS note, mid-May 2026.