
Published on July 5, 2024
Normal Distributions and the Hedge Fund Universe
Introduction to Normal Distributions
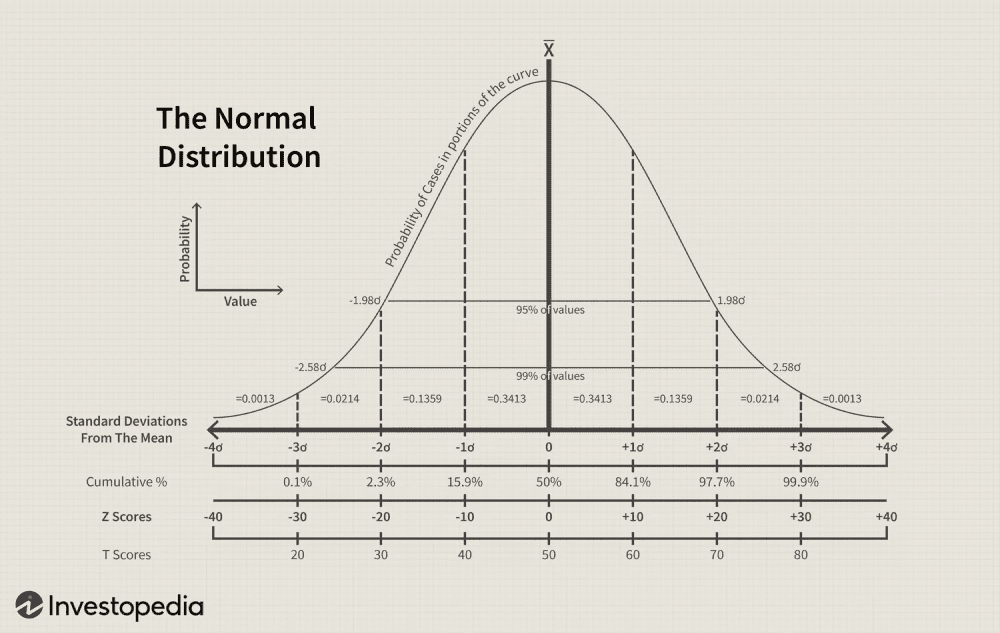
Probability distributions are functions (most often shown graphically) that describe the probability that a value will fall within a given range. In this insight, we will focus on the probability that a monthly return will fall within a given range.1 A distribution is considered normal when it is symmetrically centered around the mean or average, displays no skew, and can be fully characterized by its standard deviation (which we will explore later within this insight).2 These distributions can be used for risk assessment and portfolio management, among other applications. Normal distributions are most commonly known as bell curves.
Properties of Normal Distributions
A distribution can be characterized as normal if it fulfills a couple of different requirements. These requirements can be categorized as the Mean, Median, Standard Deviation and Kurtosis.
Mean and Median
One of the ways you can determine that a distribution is normal is to see if the mean and median are equal. This further reinforces the idea that a normal distribution is symmetrically distributed around the average. The relationship between mean and median will also come up when we discuss skewness of distribution.3
Standard Deviation and the 68-95-99.7 Rule
The standard deviation, which quantifies the dispersion of returns around the mean, serves as a key indicator of portfolio volatility. A normal distribution can be fully characterized by the standard deviation, that is, the distribution follows the 68%, 95%, and 99.7% rule. This means that 68% of the distribution falls within one standard deviation to either side of the mean, 95% of the distribution falls within two standard deviations, and 99.7% of the distribution falls within three standard deviations.4
Skewness and Kurtosis
Positive skewness indicates that the distribution has a longer right tail, suggesting the presence of more extreme positive returns. Negative skewness implies a longer left tail, indicating more extreme negative returns.5
Kurtosis measures the flatness of the distribution. Distributions with a large kurtosis have fatter tails, that is, they have more data within the sample that is further distributed from the center (or mean or median) of the distribution.6 The Kurtosis of a normal distribution is 3.
Application in Investment Management
Understanding the historical distribution of a hedge fund or portfolio’s returns can be helpful for portfolio managers and allocators in several ways:
Risk Assessment: The distribution of returns provides a framework for assessing the risk of investment portfolios and helps allocators set expectations for a given portfolio.
Asset Allocation: By understanding the expected range of returns and their probabilities, managers can allocate assets to achieve desired risk-return profiles. For example, if one particular strategy displays high kurtosis or has fat tails then future strategies that are more “normal” may be prioritized.
Performance Evaluation: Comparing actual investment returns to the expected distribution under the normal model helps evaluate portfolio performance. Deviations from the expected distribution may signal a need to reassess the expected return profile for a given strategy or portfolio.
Distribution of HFRI Hedge Fund Indices
For purposes of illustration, see below the distribution and key statistics of monthly returns for the HFRI Hedge Fund Index Family.
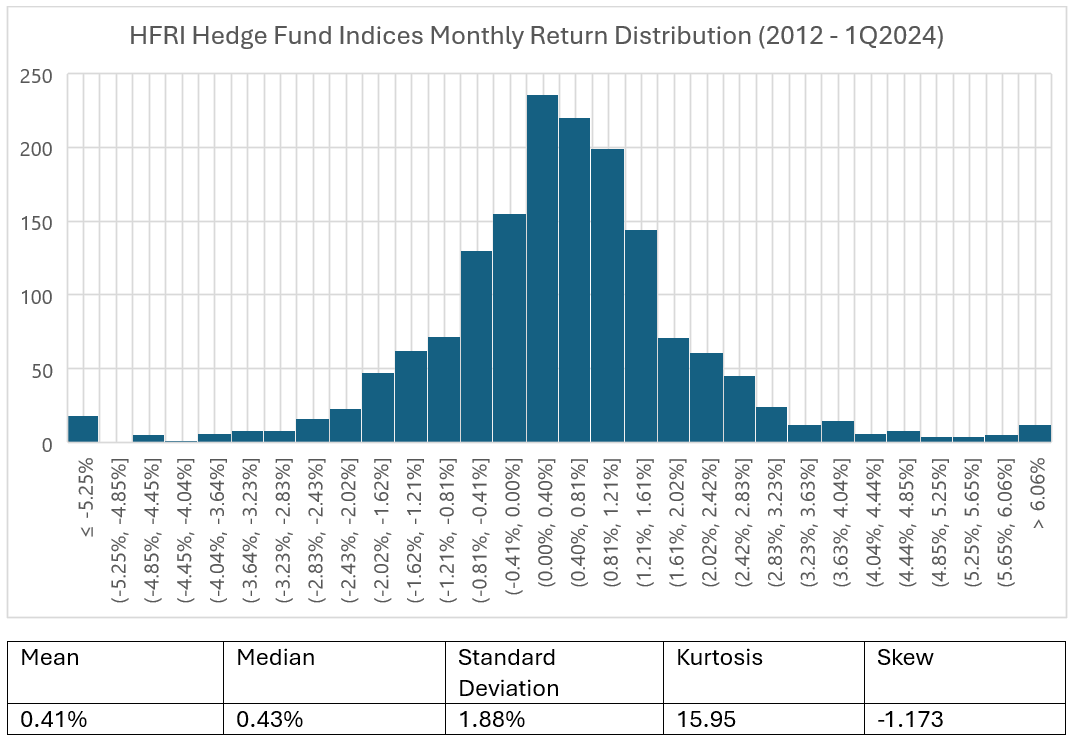
As you can see there are some attributes of the distribution that suggest the returns of the index family are close to normal. The mean and median are nearly identical. The general shape of the distribution is a bell curve though you can immediately see that the index family does have fatter tails than a normal distribution.
The kurtosis value this high is a numerical representation of how non normal this distribution is. These fat tails represent the fact that within these broad indices many negative and positive tail events have occurred. It follows that the 68-95-99.7 rule also does not hold; since there are fatter tails than exist in a normal distribution, then 99.7% of the sample does not fall within 3 standard deviations of the mean.
Outside of purely reviewing the statistical properties of the distribution, we can see that the HFRI index family platform is generally situated around the mean. And that, in general we can expect that returns over time will cluster around the mean of 0.41% return for a given month. That said, while there have been a significant amount of tail returns (both to the positive and negative), overall, these tail events have leaned towards the downside in a negative skew.
Conclusion
The distribution of the HFRI index family shows how critical manager selection can be within the hedge fund space. You cannot just allocate to the space through low quality managers and expect hedge fund beta to provide your portfolio with risk mitigation. Looking at return distributions is one of the many statistical and analytical lenses that the Crystal Capital research team uses to ensure we are sourcing managers with a track record of providing high quality returns with the goal of providing alpha through time.
Sources:
- Probability Distribution Explained: Types and Uses in Investing (investopedia.com)
- Normal Distribution: What It Is, Uses, and Formula (investopedia.com)
- Normal Distribution: What It Is, Uses, and Formula (investopedia.com)
- Empirical Rule: Definition, Formula, Example, How It's Used (investopedia.com)
- Skewness - Overview, Types, How to Measure and Interpret (corporatefinanceinstitute.com)
- Kurtosis: Definition, Types, and Importance (investopedia.com)
See the list of third-party Hedge Funds on our platform.
For financial advisors only.