
Published on May 20, 2024
The Market Concentration Conundrum
Equity market indices had a banner year in 2023 and are continuing those gains into this year, but the details are more nuanced. In 2023, the largest U.S. ETF by capitalization, the Vanguard Total Stock Market Index, rose 14.94% while the S&P 500 gained 24% -- but Nvidia crushed them with a gain of 237%.1 The divergence continues into 2024, as Nvidia is up over 85% while the S&P 500 has gained 8.9%. These outsized gains have market followers trying to determine market concentration, breadth, and future impacts.
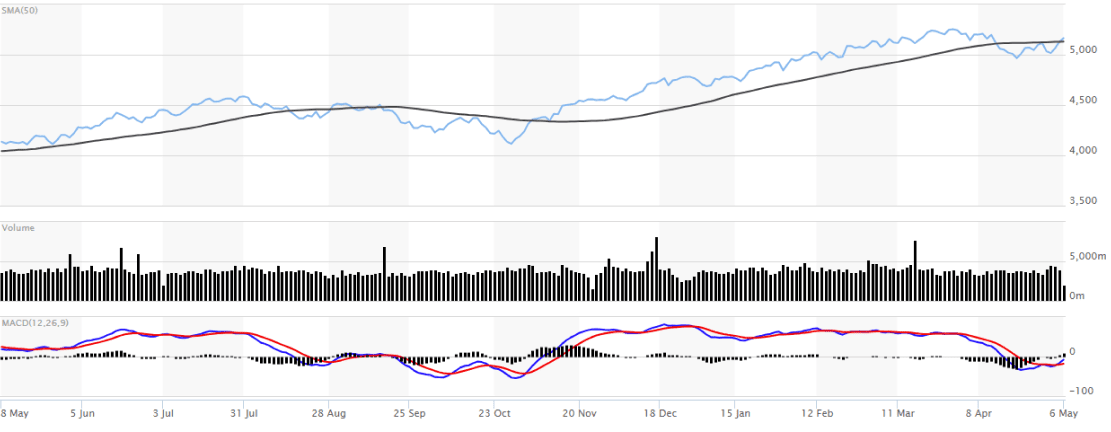
Market breadth helps investors gain valuable insights into the health of the market. One commonly used measure is the 200-day moving average, gauges the percentage of stocks trading above their 200-day moving average. The chart is a key technical indicator used to determine overall long-term market trends and is calculated by plotting the average price over the past 200 days, along with the daily price chart and other moving averages. The greater the number of stocks trading over this average, the more bullish the market. A rising indicator above 50% indicates broad market strength.
Market breadth dipped in October, only to rebound following hopes of a pivot from the Federal Reserve. More recently, 80% of stocks are trading over the 200-day moving average.2
Market Breadth as Measured by the 200-Day Moving Average
Source: Market Watch
A rising market index combined with more advancing stocks indicates a healthy market, while an increasing index with narrow breadth could point to a rally that is losing steam.
Market Concentration
While market breadth reveals how many individual stocks are participating in a market move, market concentration refers to a small number of companies' influence on overall market value or a specific sector.
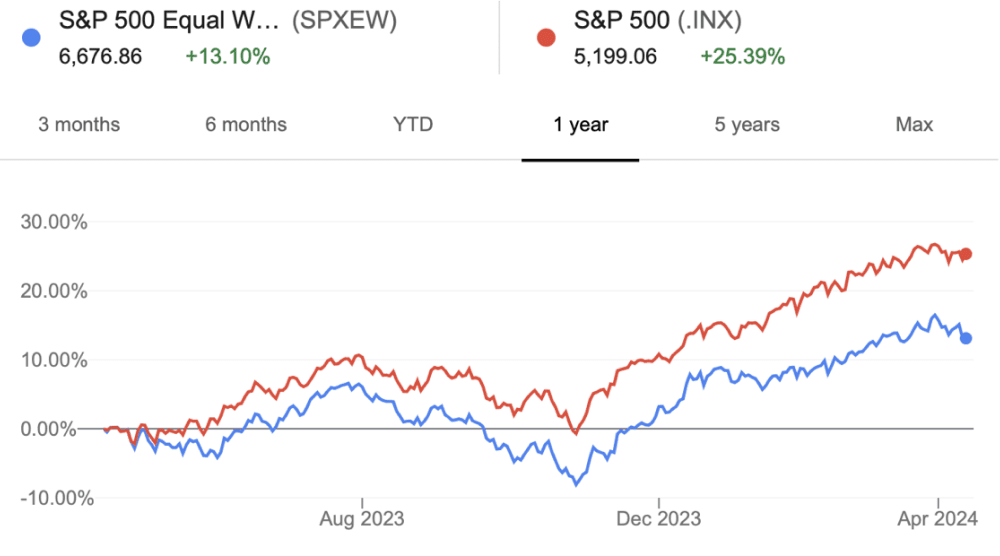
One way to view how the most dominant stocks in an index are impacting returns is by comparing the cap-weighted version to the equal-weighted version. As its name implies, the S&P 500 equal-weighted index gives an equal weight to each stock in the index, as opposed to the cap-weighted index, which gives a higher weighting to larger-cap names. The cap-weighted S&P 500 outpaced the equal-weighted version of the index in 2023 by the largest percentage-point difference since 1998.3 Today, the relative performance of the equal-weighted index has improved, but a wide divergence remains.
S&P 500 Market Cap versus Equal Weighted
Source: Google Finance, Apr. 11, 2024.
Market Concentration and The Magnificent Seven
Many of today’s market leaders are the same names from over a decade ago. In 2013, the term “FAANG"—referring to Facebook, Apple, Amazon, Netflix, and Google—was originally coined. Today, these leaders are joined by Nvidia and Tesla and are referred to as the Magnificent Seven. Comprising approximately 30% of the S&P 5004, these behemoths are so big that their combined profits would make them the second largest country exchange in the world.5 At these levels, market concentration is raising concerns.
At the same time, leaders such as Microsoft and Apple have been among the most successful in the world for years. Global technology spending is expected to keep growing. One projection calls for worldwide IT spending to total $5.1 trillion in 20246, an increase of 8% from 2023 as companies invest in AI and automation to improve operational efficiencies, strengthen infrastructure, enhance customer experiences, and bridge IT talent gaps.
Measuring Market Concentration
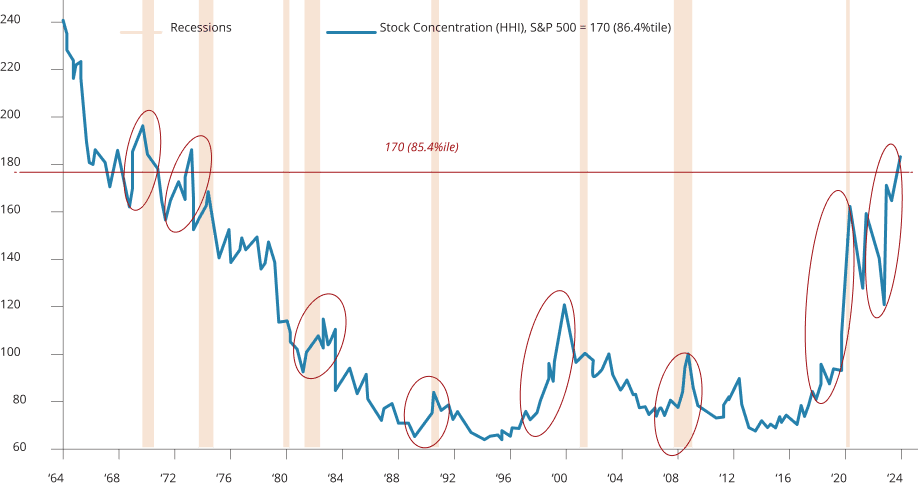
The Herfindahl-Hirschman Index (HHI)7 provides a quantitative framework for assessing market concentration and determining market competitiveness. The HHI is now showing market concentration at its highest level since the early 1970s.
S&P 500 Concentration as Measured by the HHI
Source: JP Morgan. Data through Jan. 31, 2024
A higher HHI signifies a more concentrated portfolio, meaning fewer, but larger exposures. While this measure offers one way to assess concentration, a more comprehensive understanding of risk requires considering factors beyond just the HHI.
History of Market Concentration
Market concentration has a long and complex history, with several notable negative periods:
Nifty Fifty: From the 1960s to the 1970s, around 50 large, blue-chip companies dominated the U.S. stock market. This revolving list of companies with names like Coca-Cola, General Electric, and IBM was known for consistent earnings growth and high P/E ratios. However, low economic growth due to the recession of 1973–1975 led to these stocks lagging the overall market.
The Japanese Real Estate Bubble: Fueled by low interest rates and government policies, land and property prices in Japan skyrocketed during the 1980s, and Japan briefly became the world’s largest stock market. However, the concentrated market ended in the early 1990s, leading to a "lost decade" of economic stagnation for Japan.
The dot.com or TMT bubble: Synonymous with market mania, the dot.com era coincided with the widespread adoption of the internet. While some stocks, including Cisco and Microsoft, are still market leaders, many names have disappeared. Market concentration became a concern as investor focus narrowed heavily on these tech giants, and the bubble eventually burst in 2000, leading to a significant market crash.
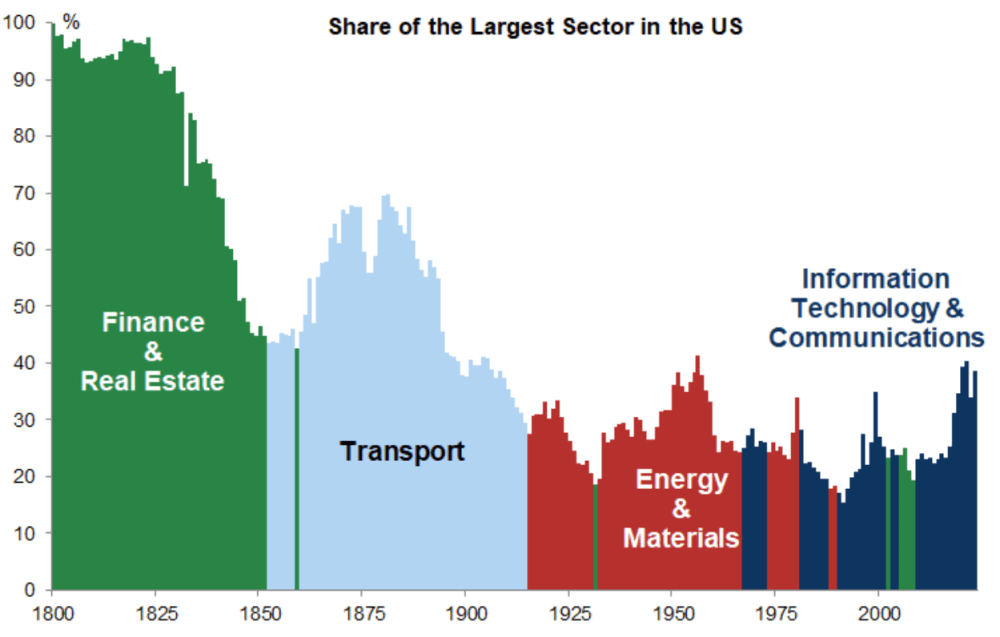
However, not all periods of market concentration have led to bubbles. In the late 19th century, consolidation in the U.S. railroad industry saw significant concentration, but it also played a pivotal role in national development by facilitating trade, opening new markets, and spurring industrial growth. Similarly, the steel industry was dominated by a few names, but these market leaders also revolutionized construction and manufacturing.
With a steady evolution of innovation, today's technology sector is integral to global economic growth and is expected to continue revolutionizing sectors and industries. Artificial intelligence is fueling a surge in the technology sector, and it's essential to consider that, despite recent growth, the sector's relative size (as a percentage of the overall market) is still roughly equivalent to the energy sector at its peak in the 1950s. And the Magnificent Seven are not all in the technology sector. Tesla and Amazon are considered consumer discretionary companies, while Meta and Alphabet are in the communications sector.
Past Periods of Market Dominance
Investing In Market Concentration
Market leaders' long-term success depends on solid fundamentals and strong leadership, and innovation within dominant companies can drive overall market growth in concentrated sectors.
Technology adoption and digitalization continue to be the top drivers of business and job transformation in the global economy. However, a highly concentrated market with limited participation can be more vulnerable to crashes if the dominant players falter. There are also heightened fears of regulation around technology dominance that could hinder future growth for the current market leaders.
Concluding Thoughts
As traditional investment markets continue to face periods of heightened volatility and concentration, many savvy investors are turning to alternative investment options for diversification and risk management. Incorporating hedge funds into your portfolio can offer a robust mechanism for diversification and risk mitigation. As financial advisors, it’s essential to consider these options to better serve your clients and safeguard their investments against the inherent risks of market concentration.
With their unique investment strategies and the potential to deliver strong risk-adjusted returns, hedge funds are increasingly being recognized as a valuable tool to offset the perils associated with concentrated market movements. These alternative investments offer a unique blend of strategies, including short selling, leverage, and derivatives, which are not commonly found in traditional equity and bond portfolios. This versatility allows hedge funds to reduce volatility & correlation and improve returns, as they can profit in both rising and falling markets. In an era where a handful of companies dominate the market, the need for effective risk management becomes more pressing. Consequently, hedge funds can be valuable for investors looking to enhance their portfolio's resilience against these concentration challenges.
Sources:
- Devalla, K. (2024, January 5). How the largest stock funds performed in 2023. Morningstar, Inc.
- LPL Financial. (2024, February 21). Market breadth and market returns.
- S&P 500 set to beat equal-weighted index by widest margin since 1998. (n.d.).
- The concentration conundrum; what to do about market dominance. (n.d.-b).
- Smith, E. (2024, February 20). Magnificent 7 profits now exceed almost every country in the world. should we be worried? CNBC.
- Gartner forecasts worldwide it spending to grow 8% in 2024. Business Wire. (2023, October 18).
- Bromberg, M. (n.d.). Herfindahl-Hirschman Index (HHI) definition, formula, and example. Investopedia.
See the private funds investing in today’s market leaders while incorporating diversification.
For financial advisors only.