
Published on November 22, 2024
US Stock Market Outlook: Are the Bears Coming Out of Hibernation?
With almost 501 new record highs in 2024 alone, what’s next for the US stock market outlook—is it more double-digit growth, or is a slowdown on the horizon?
While there was a brief Covid-related correction, the current bull market was preceded by two other major bull markets. And despite some bumps along the way, the S&P 500 Index has risen over 20% year to date, and has more than tripled in the last 10 years.
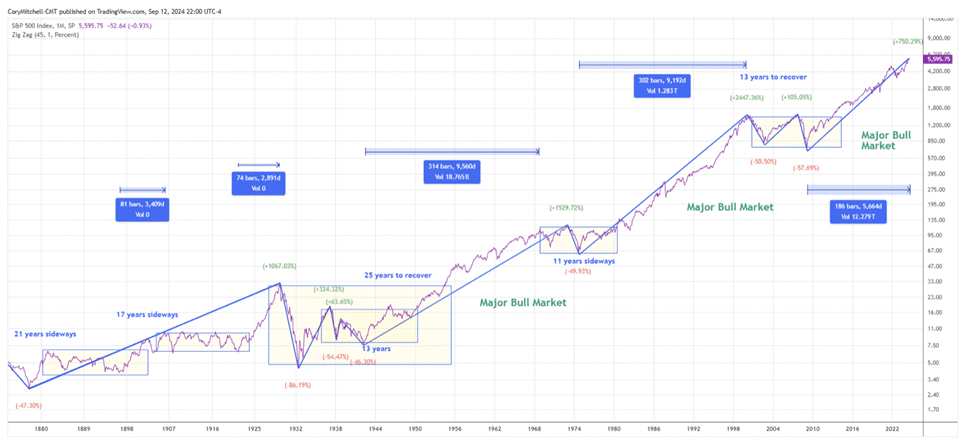
Have the conditions that sparked these bull markets faded? From 2009-2015, and then again from 2020-20212, short-term rates in the US were near-zero. But now, central banks’ quantitative easing programs have come to an end, and government debt levels have skyrocketed. While the Federal Reserve has begun to loosen monetary policy once again, the probability of another decade of zero interest rates appears highly unlikely.
Valuation Impact on the US Stock Market Outlook
The current P/E valuation of the S&P 500 is 27.07 — historically higher than in recent history. Shown below is the rolling five-year average since 1995 for the S&P 500, as represented by the SPDR S&P 500 ETF.3
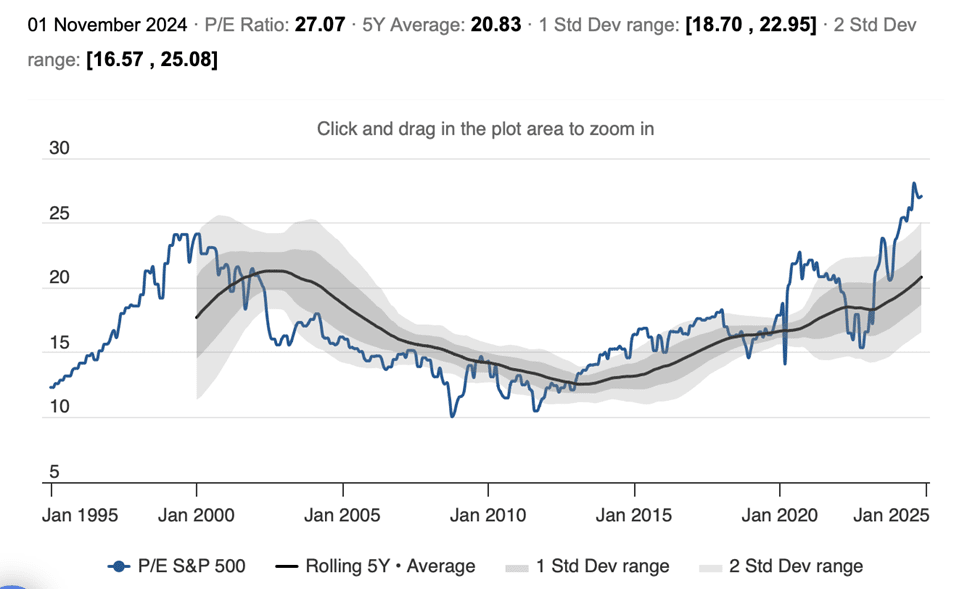
These stretched valuations are prompting many analysts to pivot on their US stock market outlook. The chief US equity strategist of Goldman Sachs4 has reduced his estimates for annual nominalized US equity returns to 3% during the next 10 years.
One of the main reasons behind Goldman’s prediction is the Cyclically-Adjusted Price-to-Earnings ratio (CAPE) created by Nobel laureate Robert Shiller. CAPE expands on a simple price-earnings ratio by looking at 10 years of earnings (adjusted for inflation). The longer time frame helps to smooth things out, and since 1940, the CAPE has averaged about 22x. But today, CAPE is at 35.23.5
But CAPE is not a static measure, and it has steadily moved higher over the years. As recently as 2017, the US stock market has been consistently over 30 since 2020, while its long-term historical norm has been 16.6.6
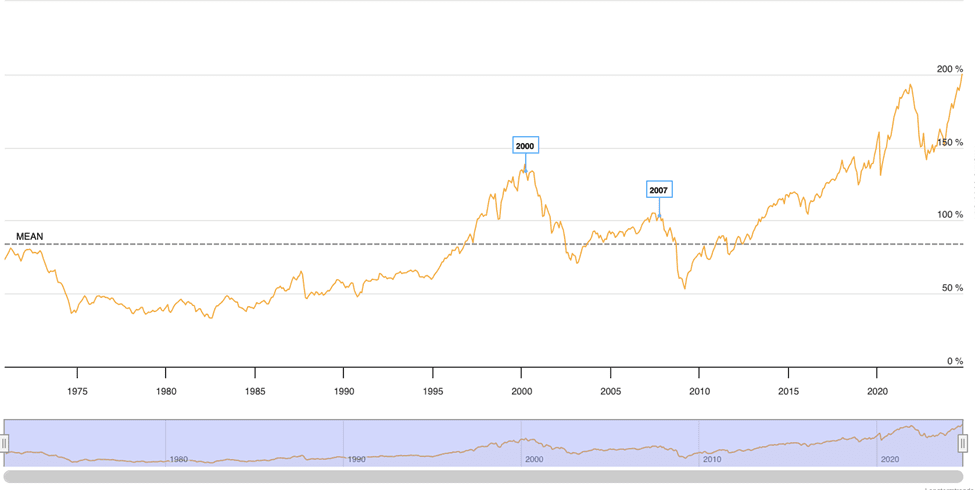
And then there’s the Buffet Indicator7, which has hit an all-time high. Endorsed by Warren Buffet in 2001, it measures Market Cap to GDP and has now gained prominence as a long-term valuation indicator for stocks. Buffett referred to it as "probably the best single measure of where valuations stand at any given moment." This statement has drawn attention to the indicator's potential significance in assessing market conditions.
To provide insight into the relative stock market valuation, the Buffett Indicator divides the total market value of all publicly traded stocks within a country by the country's Gross Domestic Product. The index typically used is the Wilshire 5000, widely regarded as the definitive benchmark for the US equity market, which aims to measure the total market capitalization of all US equity securities with readily available price data.
Buffet Indicator All-Time High
Source: The Buffett Indicator: Market Cap to GDP - Updated Chart | Longtermtrends
According to the Buffet Indicator, if the stock market value is growing much faster than the actual economy, then it may be in a bubble. The indicator reached a historic high of 200% in October.
In his 2001 explanation, Buffet said, "If the ratio approaches 200%— as it did in 1999 and a part of 2000 — you are playing with fire.” The last record high was in November 2021, when it hit 197%, and then the stock market dropped 18% in 2022.
But is it always right? The Buffet Indicator has a success rate of 50 percent —making it among the most reliable of most indicators. However, the “Buffett Indicator” has also shown stocks being overvalued for an extended period of time without entering a bear market.
Worth noting is that Mr. Buffett currently has $325 billion in cash in Berkshire Hathaway's portfolio this year—and hasn't made many publicly disclosed stock purchases since the start of the year, either.8
Market Concentration and its Impact on the US Stock Market Outlook
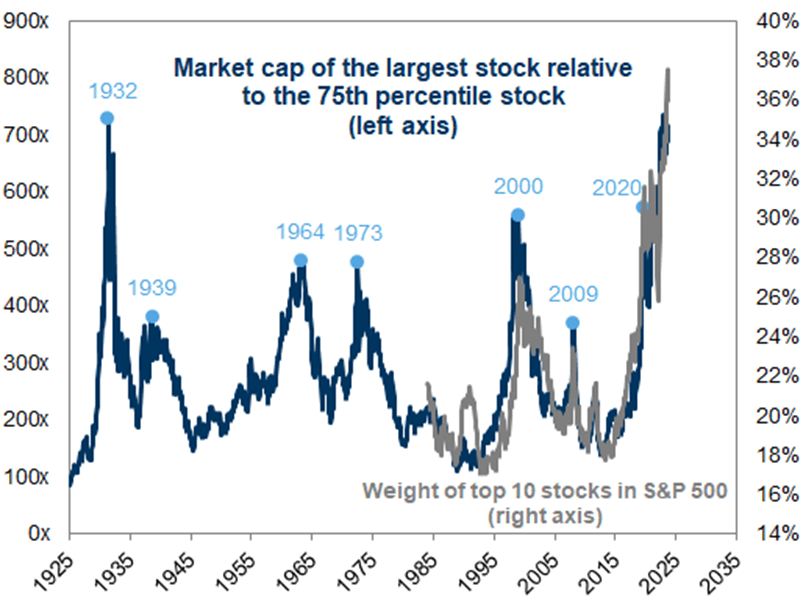
The dominance of several stocks—and their outsized influence on stock market returns—profoundly impacts markets. The “Magnificent Seven” stocks comprised over 35% of the S&P 500, increasing the divergence between the S&P 500 Equal Weighted Index and the S&P 500, which is capitalization weighted.9
Other periods of intense market concentration have resulted in market downturns.
The Effect of Debt on the US Stock Market Outlook
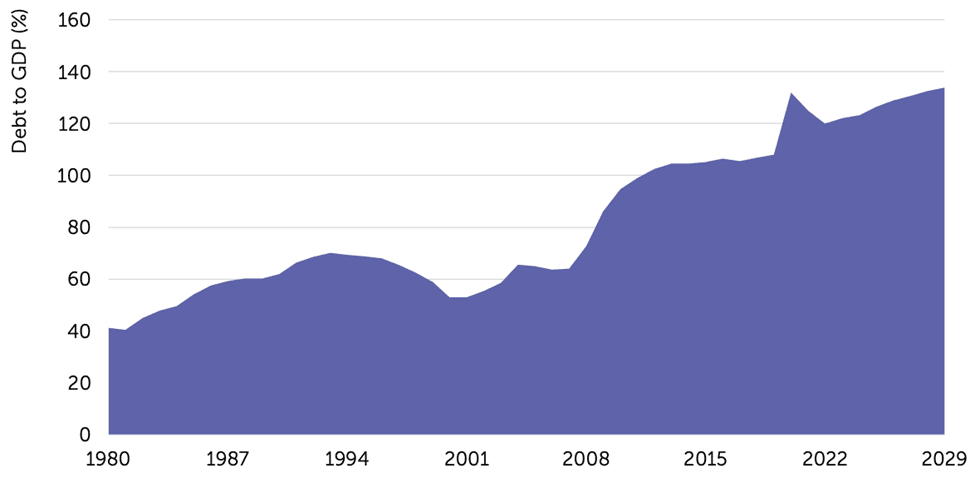
Other warning signals for the US equity market outlook include geopolitical turmoil and unsustainable government debt. The US national debt surged after the Great Financial Crisis. Leading up to the crisis, low interest rates and loose lending standards resulted in government intervention with massive bailout programs. Since then, government spending has steadily increased.
The US national debt continues to increase without any solution, and the repercussions may loom large. With the increasing debt comes larger interest payments, resulting in fewer dollars for other government spending or less flexibility to respond to future crises. It can also mean fewer opportunities for businesses looking to expand or invest in education.
Why the US Equity Market Outlook May Include Slower Growth
Does this mean the decade of outsized S&P gains is over, and passive stock picking may no longer produce double-digit returns? This may be the right environment for active stock selection and downside protection - an environment that favors skilled investment professionals with proven track records and experience in multiple market cycles.
Sources:
- S&P 500 Roared
- Federal Funds Rate History
- S&P 500 Index: current P/E Ratio
- Updating our long-term return forecast for US equities to incorporate the current high level of market concentration
- Cyclically Adjusted PE Ratio
- CAPE Fear: Why CAPE Naysayers Are Wrong | Research Affiliates
- The Buffett Indicator: Market Cap to GDP - Updated Chart | Longtermtrends
- Warren Buffett sitting on over $325 billion cash as Berkshire Hathaway continues selling Apple stock - CBS News
- 35% of the S&P 500 Is Concentrated in the "Magnificent Seven." Here's What That Means for Your Portfolio. | Nasdaq
View the institutional private investments on our platform and build customized portfolios for your clients.
For financial advisors only.