
Published on February 14, 2024
USA Government Debt is Soaring. What Are the Implications of Rising Deficits for Investors?
The USA’s government debt is rising. According to the Treasury's Fiscal Service office, debt for fiscal year (FY) 2023 totaled $33.2 trillion— $2.2 trillion higher than FY 2022. Interest on that debt was $875.5 billion in FY 2023, $151.9 billion higher than FY 2022.1 The federal deficit increased to 6.3% of GDP from 5.4% in FY 2022— and 2024’s deficit is expected to continue to increase further.2
This colossal figure is the result of years of stimulus spending, tax cuts, and decreased revenue, only to be exacerbated further during the pandemic. Currently, USA government debt is the largest in dollar terms of any country.3 But the United States is by no means alone. A recent estimate showed that Euro Zone countries will issue $165 billion in bonds in January alone to refinance their debt.4
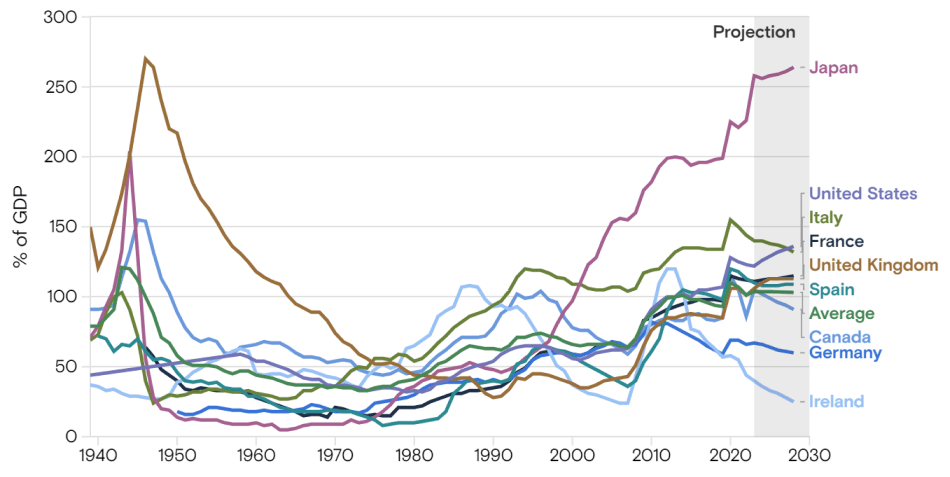
Debt ratios, a percentage of each country’s GDP, are a better indicator of a country’s fiscal policy, and they are also near historic highs.
Debt Ratio by Country
Financing the Debt
In 2023, the U.S. Treasury borrowing was estimated at $1 trillion, and that number is expected to double in 2024 to $2 trillion as total USA government debt reaches $34 trillion.5
U.S. Treasury bond issuance by year
Privately held net marketable Treasury coupon issuance is expected to increase to about $1.9 trillion in 2024.
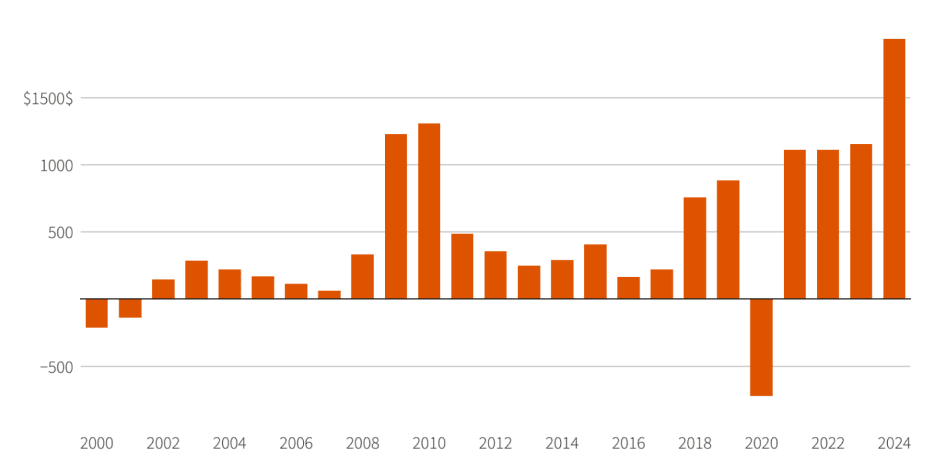
Note: The data excludes bonds that were bought by the Federal Reserve.
USA Debt and Bond Yields
Due to the increasing deficit, Fitch Ratings downgraded the debt of the United States to AA+ this past summer, stripping the country of its AAA credit rating.6 This move, following a similar downgrade by S&P Global Ratings in 2011, had a short-lived impact on Treasury prices. Following the announcement, Treasury yields briefly turned negative, then began to climb again.
After yields spiked to 5% in October, bond prices rallied during the last two months of November and December following Treasury’s decision to scale back the sale of longer-term securities and offer shorter-term debt. In November, Treasury Secretary Janet Yellen slowed the increase in sales of 10-year and 30-year bonds, instead issuing more T-bills than the market expected. Combined with anticipation of a more dovish Fed, bond prices rallied into year-end.
US Treasury Yields 2005 - 2024
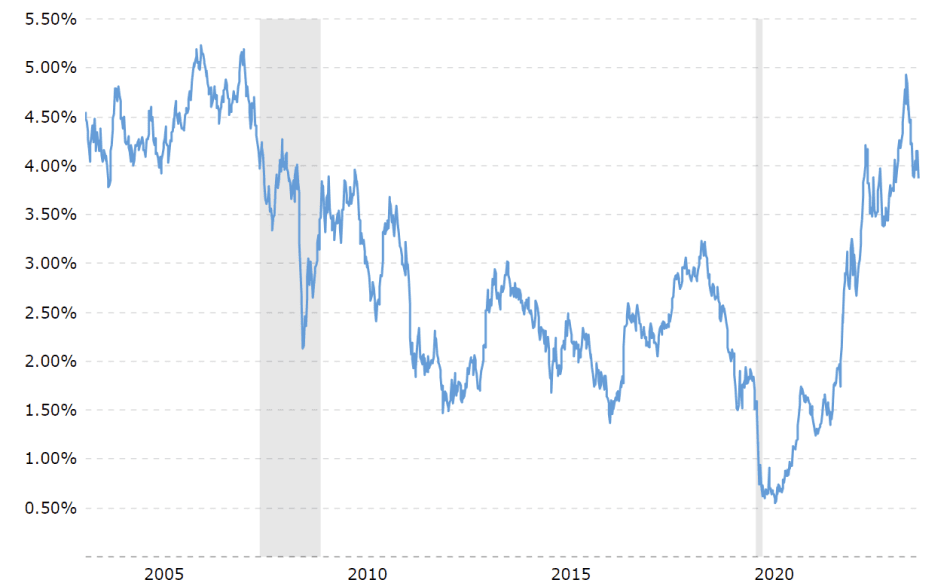
Source: 10 year Treasury Rate - 54 Year historical chart. MacroTrends.
Impact of the Fed and Quantitative Tightening
Quantitative tightening involves letting bonds mature without refinancing them. Not reinvesting all the proceeds from maturing securities is another way for the Fed to enact monetary policy, commonly referred to as runoff. The runoff increases the bond supply investors must absorb, pushing up long-term rates. In late 2008, the Fed began a bond-buying spree amid the financial crisis to stimulate the economy further. Spanning the following six years, the central bank added $3.7 trillion to its balance sheet, for a total of $4.5 trillion.7
In 2017, when the Fed began to unwind these holdings through runoff, it ignited a sharp spike in a key overnight lending rate. These repo rates, widely relied upon by banks and financial firms, soared as high as 10% before the central bank resorted to buying Treasury bills again to restore stability.7
Federal Reserve Balance Sheet Trends
| Event (Dates) | End Size | Change |
|---|---|---|
| Financial Crisis (09/08-12/08) | $2.2 | +$1.3 |
| QE2 (03/08-05/10) | $2.3 | +$0.4 |
| QE3 (11/10-07/11) | $2.9 | +$0.6 |
| Roll Off (09/17-08/19) | $3.8 | -$0.7 |
| Repo Turmoil (09/19-02/20) | $4.2 | +$0.4 |
| COVID-19 (03/20-5/22) | $8.9 | +$4.8 |
Source: CRS calculations based on Federal Reserve data.
In response to the financial upheaval due to the COVID-19 pandemic, the Fed resumed large-scale purchases, bringing in the total to $8.97 trillion, the largest amount on record. The purchasing ended in March 2022, followed by a renewed shrinkage three months later. From March 2023 through September 2023, the Fed reduced its holdings by $700 billion, as shown below.
Assets, Liabilities, and Capital of the Federal Reserve System
| Item | March 29, 2023 | September 27, 2023 | Change from March 29, 2023 |
|---|---|---|---|
| Total assets | 8,706 | 8,002 | -704 |
| Securities held outright | 7,926 | 7,440 | -486 |
| U.S. Treasury securities | 5,329 | 4,958 | -371 |
| Federal agency debt securities | 2 | 2 | 0 |
| Agency mortgage-backed securities | 2,594 | 2,480 | -114 |
| Repurchase agreements | 55 | 0 | -55 |
| Foreign official | 55 | 0 | -55 |
Source: Federal Reserve balance sheet developments. Federal Reserve. (2023, November).
The Federal Open Market Committee has said that balance sheet reduction would continue until the point at which the balance sheet is just large enough to implement monetary policy efficiently, primarily by continuing to target the federal funds rate. Fed officials plan to look at market signals to identify the right level of reserves. Market participants say the Fed needs to manage runoff carefully as banks are required to hold higher-quality assets to meet unexpected demands for cash.
Investing in bonds amid rising USA government debt

In 2024, there are opposing views on the bond markets. Expectations of a dovish Fed might see the late 2023 bond price rally extending well into the new year. However, the expected surge in U.S. Treasury issuance could force yields higher to entice enough buyers.
So, which way will the winds blow for bond markets this year? Following January’s policy meeting, recent comments by Fed Chair Powell shifted hopes of rate cuts further into 2024, sending bond yields higher and prices lower.
Overall, the influx of over $2 trillion in new bonds will likely create a complex and dynamic market environment. Investors will need to evaluate the potential impact on the broader economy, as financial stability will depend on how this additional debt is managed and used.
In this complex landscape, seeking exposure to institutional managers with a proven track record of investing in bond markets is prudent. Crystal Capital Partners offers financial advisors and their clients the opportunity to create portfolios made up of institutional funds with the know-how and long-term track record of navigating global markets and the flexibility to reposition themselves in rapidly changing conditions.
Sources:
- Office, U. S. G. A. (2023, November 9). Financial Audit: Bureau of the Fiscal Service’s FY 2023 and FY 2022 Schedules of Federal Debt | U.S. GAO.
- Monthly Budget Review: September 2023. Congressional Budget Office. (2023, October 10).
- National debt by country. National debt by country/countries with the highest national debt 2024.
- Robertson, H. (2024, January 5). Wave of debt sales adds to January nerves in Euro Zone ... Reuters.
- Barbuscia, D. (2024, January 16). Coming flood of US treasury issuance unsettles some investors after Blazing rally. Reuters.
- (2023, August 1). Fitch Downgrades the United States’ Long-Term Ratings to “AA+” from “AAA”; Outlook Stable. Fitch Ratings.
- The Fed’s balance sheet and quantitative tightening. Congressional Research Service. (2024, February 6).
In this complex landscape, seeking exposure to institutional managers with a proven track record of investing in bond markets may be prudent.
For financial advisors only.